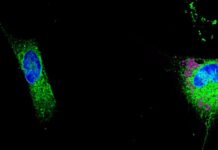
Fig. 2
Alzheimer’s disease (AD) diagnosis prediction based on APOE4 status, Aβ misfolding status, and both predictors together. AD diagnosis prediction was examined in three groups, Follow-up after 8 and 14 years and between 8 and 14 years. Portrayed above are area under the curve (AUC) values and P values from receiver operating characteristic (ROC) curve contrast analyses between predictors. Specific AUC and 95% confidence intervals (CIs) for the AD predictors were [AUC (95% CI)]: Aβ status: 0–8 yrs, 0.82 (0.73–0.91), 8–14 yrs, 0.80 (0.73–0.88), 0–14 yrs, 0.81 (0.75–0.87); APOE4 status: 0–8 yrs, 0.59 (0.48–0.69), 8–14 yrs, 0.62 (0.53–0.71), 0–14 yrs, 0.61 (0.54–0.67); Aβ + APOE4 status: 0–8 yrs, 0.85 (0.77–0.94), 8–14 yrs, 0.84 (0.77–0.92), 0–14 yrs, 0.85 (0.79–0.90).


