Fig. 2
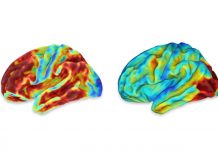
T-statistic map of partial correlation between tau burden and local thickness in the MTL cortical ribbon, with time between MRI and PET scans and age as covariates. Significant clusters after family-wise error rate correction are circumscribed with black contours. There is considerable overlap between A+ and A− clusters on both sides. However, hippocampal clusters in A− tend to extend farther distally from the subiculum-CA boundary in the body region near the CA1/CA2 boundary, e.g., as indicated by the red circle on the left hemisphere. Abbreviations: A+, amyloid-β positive; A−, amyloid-β negative; BA35, Brodmann area 35; BA36, Brodmann area 36; ERC, entorhinal cortex; PHC, parahippocampal cortex; DG, dentate gyrus; SUB, subiculum; MTL, medial temporal lobe; ROI, region of interest.
